Provide feedback on task output#
In this chapter we will:
add a plot widget to ‘OWClipData’ that displays histogram values of ‘data’ in [0.0, 1.0]
update the plot widget when ewoks task output changes.
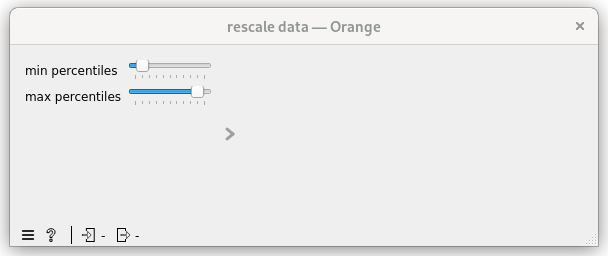
First let’s move the ‘MyWidget’ to the control area
From orange main area to control area#
diff --git a/src/orangecontrib/testtuto/OWClipData.py b/src/orangecontrib/testtuto/OWClipData.py
index 131e5da..606e74d 100644
--- a/src/orangecontrib/testtuto/OWClipData.py
+++ b/src/orangecontrib/testtuto/OWClipData.py
@@ -40,7 +40,7 @@ class OWClipData(
    id = "orange.widgets.my_project.ClipDataTask"
    description = "widget to clip data (numpy array) within a percentile range."
    want_main_area = True
-    want_control_area = False
+    want_control_area = True

    _ewoks_inputs_to_hide_from_orange = ("percentiles", )

@@ -48,7 +48,7 @@ class OWClipData(
        super().__init__(parent)

        self._myWidget = MyWidget(self)
-        self.mainArea.layout().addWidget(self._myWidget)
+        self.controlArea.layout().addWidget(self._myWidget)

        # set up percentiles
        self._myWidget.setPercentiles((10, 90))
Now the widget will looks like:
Adding a plot to the OrangeWidget#
 1class OWClipData(
 2    OWEwoksWidgetOneThread,
 3    ewokstaskclass=ClipDataTask,
 4):
 5    name = "rescale data"
 6    id = "orange.widgets.my_project.ClipDataTask"
 7    description = "widget to clip data (numpy array) within a percentile range."
 8    want_main_area = True
 9    want_control_area = True
10
11    _ewoks_inputs_to_hide_from_orange = ("percentiles", )
12
13    def __init__(self, parent=None):
14        super().__init__(parent)
15
16        self._plot = Plot1D(self)
17        self.mainArea.layout().addWidget(self._plot)
18        self._myWidget = MyWidget(self)
19        self.controlArea.layout().addWidget(self._myWidget)
20
21        # set up percentiles
22        self._myWidget.setPercentiles((10, 90))
23        self._percentileChanged()
24
25        # connect signal / slot
26        self._myWidget._minPercentiles.valueChanged.connect(self._percentileChanged)
27        self._myWidget._maxPercentiles.valueChanged.connect(self._percentileChanged)
28
29    def _percentileChanged(self):
30        self.set_dynamic_input("percentiles", self._myWidget.getPercentiles())
31        data = self.get_task_output_value("data")
32        if not is_missing_data(data):
33            self.execute_ewoks_task()
34
35    def task_output_changed(self):
36        data = self.get_task_output_value("data")
37        if is_missing_data(data):
38            self._plot.clear()
39        else:
40            # compute histogram
41            histogram, _ = numpy.histogram(data, bins=100, range=(0.0, 1.0))
42            self._plot.addCurve(x=numpy.linspace(0.0, 1.0, num=100), y=histogram, legend="histogram")
43        return super().task_output_changed()
Hint
l16-17: add a silx Plot1D widget and add it to the control area
l23: make sure the ‘percentiles’ is defined at start
l31-33: percentiles input will now be defined before data input (l23). So let’s make sure data is defined before processing the ewoks task.
l35-43: task_output_changed is called once the ewoks task has been processing:
If the task failed we clear the plot (l37-38)
Else we compute the histogram and display it.
Now your processing should looks like:
Hint
You can hide some input(s) you can also hide some output(s) using the _ewoks_outputs_to_hide_from_orange class attribute.
Results
"""
clipdata.py: Core code for the ClipDataTask, which is a task to rescale 'data' (numpy array) to the given percentiles.
Includes the ewoks task and the pydantic models.
"""

import numpy
from ewokscore.model import BaseInputModel
from ewokscore.model import BaseOutputModel
from ewokscore.task import Task
from pydantic import Field


class InputModel(BaseInputModel):
    data: numpy.ndarray = Field(..., description="data to rescale")
    percentiles: tuple[float, float] = Field(
        ...,
        description="""percentiles to use for rescaling, must be a tuple of two values (p_min, p_max) with p_min <= p_max""",
    )


class OutputModel(BaseOutputModel):
    data: numpy.ndarray = Field(..., description="rescaled data")


class ClipDataTask(
    Task,
    input_model=InputModel,
    output_model=OutputModel,
):
    """
    Task to rescale 'data' (numpy array) to the given percentiles.
    """

    def run(self):
        data = self.inputs.data
        # compute data min and max
        percentiles = self.inputs.percentiles

        self.outputs.data = numpy.clip(
            data,
            a_min=numpy.percentile(data, percentiles[0]),
            a_max=numpy.percentile(data, percentiles[1]),
        )
"""MyWidget.py: contains GUI specific code"""

from silx.gui import qt


class MyWidget(qt.QWidget):
    def __init__(self, parent):
        super().__init__(parent)
        self.setLayout(qt.QFormLayout())

        self._minPercentiles = qt.QSlider(qt.Qt.Orientation.Horizontal)
        self._minPercentiles.setTickPosition(qt.QSlider.TickPosition.TicksBelow)
        self._minPercentiles.setRange(0, 100)
        self._minPercentiles.setTickInterval(10)
        self.layout().addRow(
            "min percentiles",
            self._minPercentiles,
        )

        # max percentiles
        self._maxPercentiles = qt.QSlider(qt.Qt.Orientation.Horizontal)
        self._maxPercentiles.setTickPosition(qt.QSlider.TickPosition.TicksBelow)
        self._maxPercentiles.setRange(0, 100)
        self._maxPercentiles.setTickInterval(10)
        self.layout().addRow(
            "max percentiles",
            self._maxPercentiles,
        )

    def setPercentiles(self, percentiles: tuple):
        self._minPercentiles.setValue(percentiles[0])
        self._maxPercentiles.setValue(percentiles[1])

    def getPercentiles(self) -> tuple:
        return (self._minPercentiles.value(), self._maxPercentiles.value())
"""
OWClipData.py: Code for the orange add-on binding.
"""

import numpy
from ewokscore.missing_data import is_missing_data
from ewokstesttuto.gui.MyWidget import MyWidget
from ewokstesttuto.tasks.clipdata import ClipDataTask
from silx.gui.plot import Plot1D

from ewoksorange.gui.owwidgets.threaded import OWEwoksWidgetOneThread


class OWClipData(
    OWEwoksWidgetOneThread,
    ewokstaskclass=ClipDataTask,
):
    name = "rescale data"
    id = "orange.widgets.my_project.ClipDataTask"
    description = "widget to clip data (numpy array) within a percentile range."
    want_main_area = True
    want_control_area = True

    _ewoks_inputs_to_hide_from_orange = ("percentiles",)

    def __init__(self, parent=None):
        super().__init__(parent)

        self._plot = Plot1D(self)
        self.mainArea.layout().addWidget(self._plot)
        self._myWidget = MyWidget(self)
        self.controlArea.layout().addWidget(self._myWidget)

        # set up percentiles
        self._myWidget.setPercentiles((10, 90))
        self._percentileChanged()

        # connect signal / slot
        self._myWidget._minPercentiles.valueChanged.connect(self._percentileChanged)
        self._myWidget._maxPercentiles.valueChanged.connect(self._percentileChanged)

    def _percentileChanged(self):
        self.set_dynamic_input("percentiles", self._myWidget.getPercentiles())
        data = self.get_task_output_value("data")
        if not is_missing_data(data):
            self.execute_ewoks_task()

    def task_output_changed(self):
        data = self.get_task_output_value("data")
        if is_missing_data(data):
            self._plot.clear()
        else:
            # compute histogram
            histogram, _ = numpy.histogram(data, bins=100, range=(0.0, 1.0))
            self._plot.addCurve(
                x=numpy.linspace(0.0, 1.0, num=100), y=histogram, legend="histogram"
            )
        return super().task_output_changed()